Enjoy your spring, everyone! Armed with a few pointed charts fueled by the latest data from HAR, Swamplot’s spreadsheet-wielding correspondent writes in again, this time with comments on March’s residential real-estate market report:
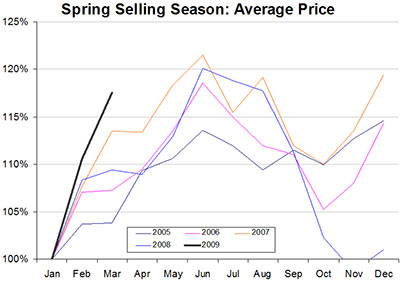
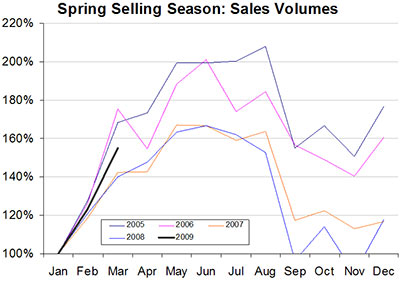
The Realtors always speak breathlessly of the “Spring Selling Season” with an almost religious reverence. Well it shows in the data. Home sales are 60-100% higher in the warm weather months. Prices are 10-20% higher, too. . . .
* * *

These graphs take the January data (a typical low point) for each year and set it to 100. Then each month’s data is expressed as a % of January. As you can see, on a price and volume basis, the warm weather is bringing out some buyers. Too bad it is from a much smaller set of well capitalized and disciplined savers.

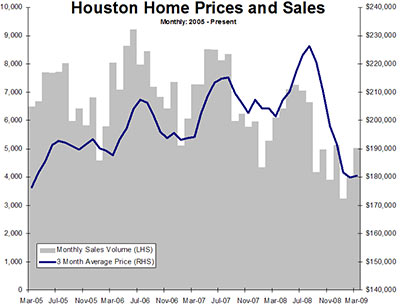
Finally, I added some early 2005 data to the long term sales/prices graph to put the late 2008 cliff dive in perspective. Chances are that anyone who bought a house in Houston in 2006, 2007 or 2008 is under water. Sure, the first instinct is to recoil and say: “not my house!!” “not in West U!” “certainly not in the Heights!!” but the numbers don’t lie.
Alas, the average has returned to early 2005 levels. Go back to 2005, look at what your home was worth then. It is the new reality. Soon it will be 2004 or 2003 levels.
I would like to hear from anyone who argues that Houston “did not have a house bubble” when we are at 2005 levels now and will soon be back at 2003 levels like the rest of the country. We got an almost 2 year late start on our correction. Just because prices rose 9% annually instead of 15% or 20% doesn’t mean that erasing 6 (or more?) years of home equity is going to be any less fun! 3 are gone now.
Home prices in Houston will be supported by the seasonal trend in the next few months, so expect some positive news flow. This will inevitably get spun into talk of a “bottom” or a “floor” by the Realtors, but it is nothing more than the effect of some nice weather, and prices will resume their downward march in September or so.